Black-Scholes-Merton Model: A Step-by-Step Pricing Example
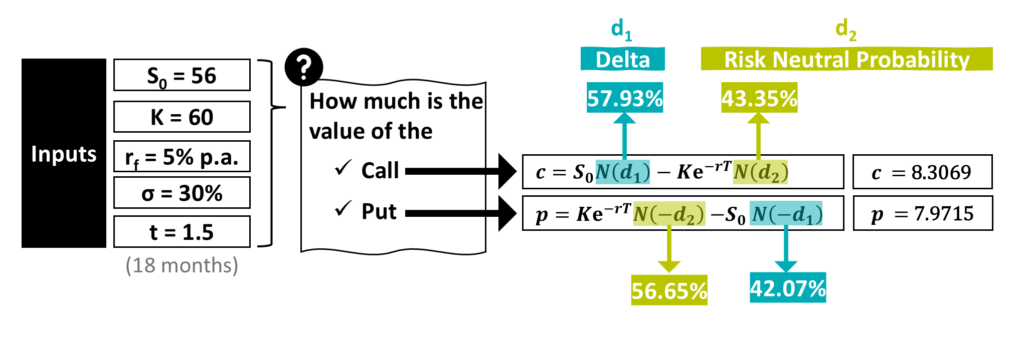
Given the underlying asset price, strike price, risk-free rate, volatility, and time to maturity, we can calculate the value of European call and put options using the Black-Scholes-Merton model. The trickiest part is understanding N(d1) and N(d2) for calls, and N(-d1) and N(-d2) for puts. While these values are often provided in FRM exam questions, let’s explore what they actually mean through a visual example.
The Intuition Behind N(d1), N(d2) | CALL OPTION
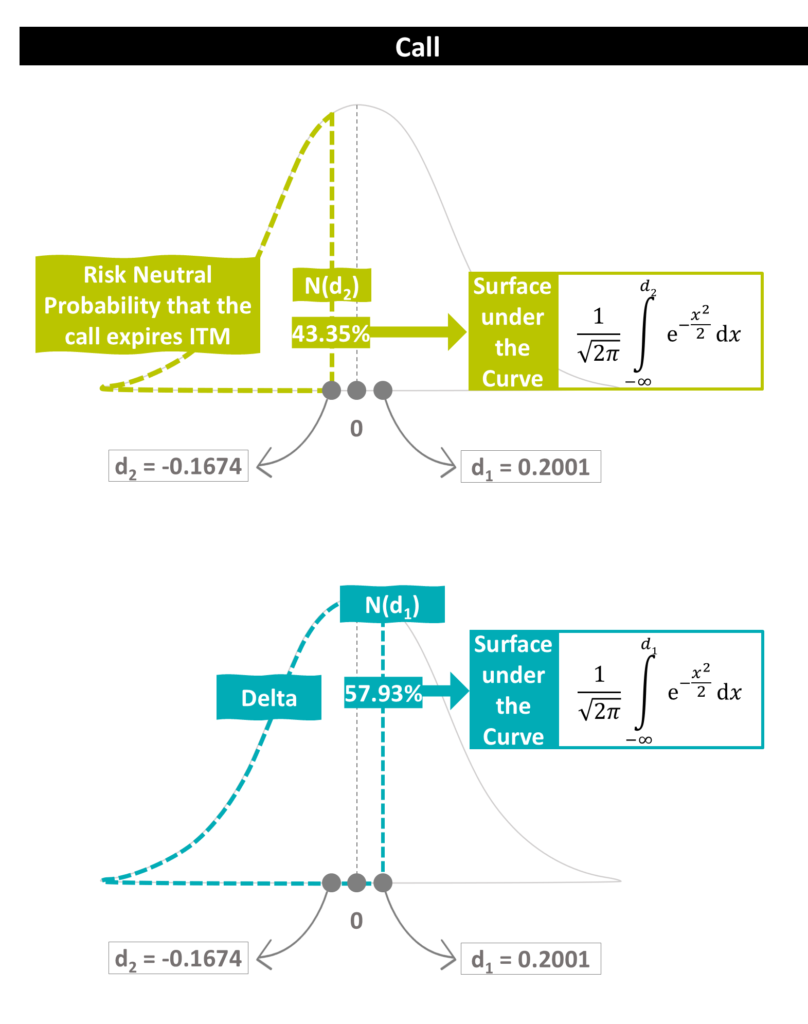
N(d2) = 43.35% represents the risk-neutral probability that the European call option expires in the money (ITM), meaning the underlying asset price exceeds the strike price at maturity. This is a probability under the risk-neutral pricing framework, not necessarily the actual probability of exercise.
N(d1) = 57.93% represents the call option delta, measuring how much the option price changes for a one-unit increase in the underlying asset price, holding other factors constant. A delta of 0.5793 means that a $1 increase in the stock price increases the call option’s value by approximately $0.58.
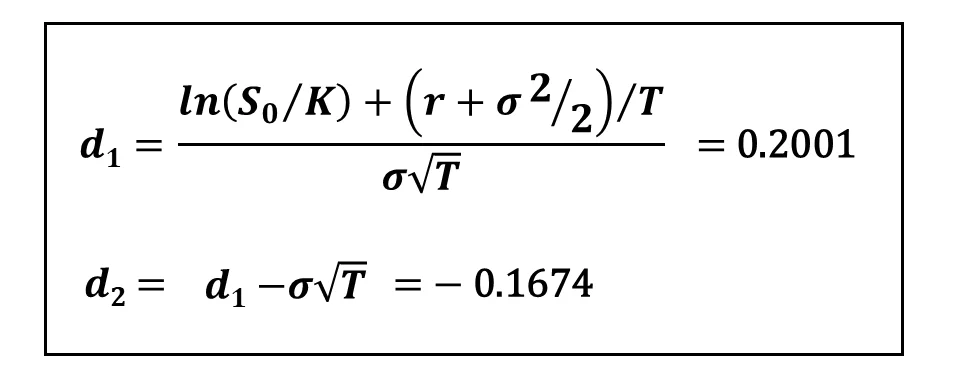
Both N(d1) and N(d2) are calculated using the standard normal cumulative distribution function (CDF). Each represents the area under the bell-shaped normal distribution to the left of its respective value. As illustrated, d1 = 0.2001 and d2 = −0.1674, resulting in N(d1) = 57.93% and N(d2) = 43.35%.
The Intuition Behind N(-d1), N(-d2) | PUT OPTION
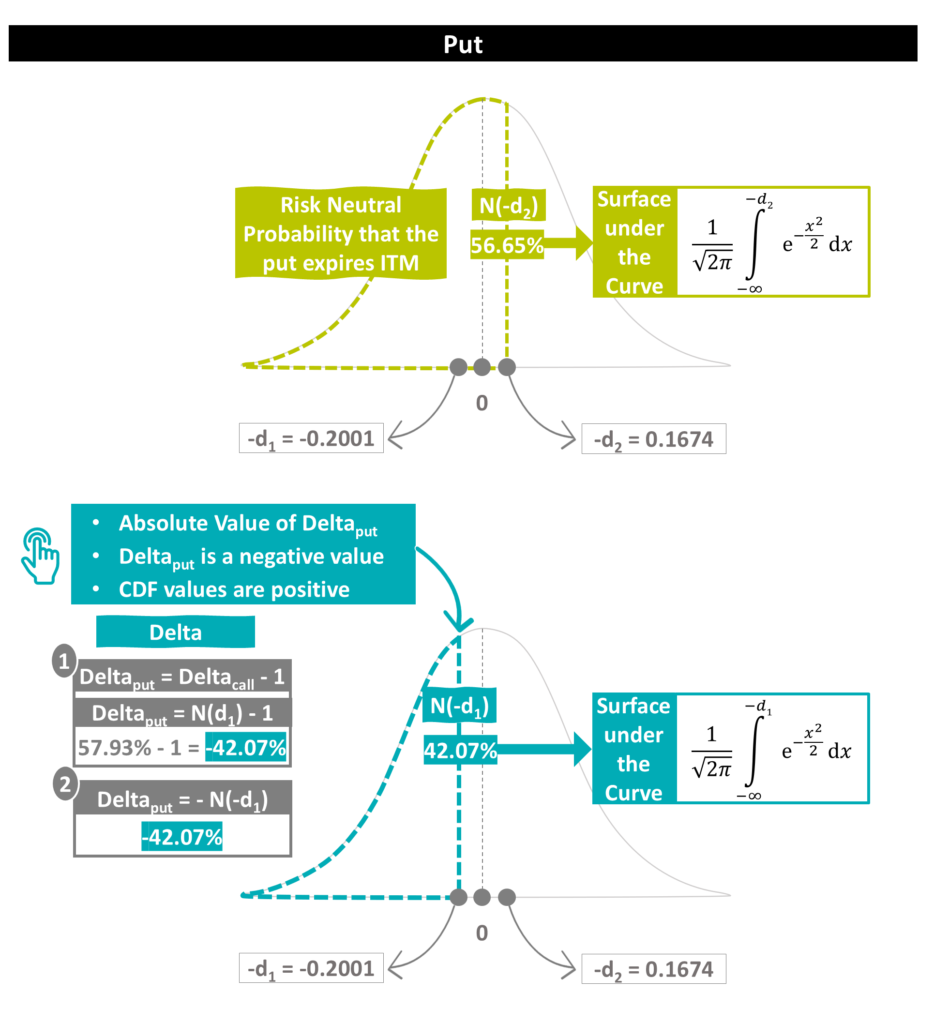
N(-d2) = 56.65% represents the risk-neutral probability that the put option expires in the money (ITM), meaning the underlying price falls below the strike price.
N(-d1) = 42.07% represents the absolute value of put delta. Put delta is negative because put prices decrease as the underlying price increases.
Put delta = N(d1) − 1 = −N(-d1). In our example, 57.93% − 100% = −42.07%.
Both values represent areas under the standard normal distribution, calculated using the cumulative distribution function (CDF).